NOTE- Commercial weather information providers contracted by FAA to provide weather observations, analyses, and forecasts (e.g., contract towers) are included in the Federal Government category of approved sources by virtue of maintaining required technical and quality assurance standards under Federal Government oversight.
NOTE- The contiguous United States (U.S.) refers to the 48 adjoining U.S. states on the continent of North America that are south of Canada and north of Mexico, plus the District of Columbia. The term excludes the states of Alaska and Hawaii, and all off-shore U.S. territories and possessions, such as Puerto Rico.
FIG 7-1-2 
NOTE- Pilots flying into areas of minimal VFR weather could encounter unforecasted lowering conditions that place the aircraft outside the pilot's ratings and experience level. This could result in spatial disorientation and/or loss of control of the aircraft.
NOTE- These first 3 elements of a briefing may be combined in any order when the briefer believes it will help to more clearly describe conditions.
NOTE- Other SUA NOTAMs (D), such as military operations area ( MOA ), military training route ( MTR ), and warning area NOTAM s, are considered “upon request” briefing items as indicated in paragraph 7-1-4b10(a).
Automatic Dependent Surveillance-Broadcast ( ADS-B ). Free traffic, weather, and flight information are available on ADS-B In receivers that can receive data over 978 MHz (UAT) broadcasts. These services are available across the nation to aircraft owners who equip with ADS-B In, with further advances coming from airborne and runway traffic awareness. Even search-and-rescue operations benefit from accurate ADS-B tracking.
Flight Information Services-Broadcast ( FIS-B ). FIS-B is a free service; but is only available to aircraft that can receive data over 978 MHz (UAT). FIS-B automatically transmits a wide range of weather products with national and regional focus to all equipped aircraft. Having current weather and aeronautical information in the cockpit helps pilots plan more safe and efficient flight paths, as well as make strategic decisions during flight to avoid potentially hazardous weather.
EXAMPLE- Example of a SIGMET :
BOSR WS 050600
SIGMET ROMEO 2 VALID UNTIL 051000
ME NH VT
FROM CAR TO YSJ TO CON TO MPV TO CAR
OCNL SEV TURB BLW 080 EXP DUE TO STG NWLY FLOW. CONDS CONTG BYD 1000Z.
EXAMPLE- CONVECTIVE SIGMET 44C
VALID UNTIL 1455Z
AR TX OK
FROM 40NE ADM-40ESE MLC-10W TXK-50WNW LFK-40ENE SJT-40NE ADM
AREA TS MOV FROM 26025KT. TOPS ABV FL450.
OUTLOOK VALID 061455-061855
FROM 60WSW OKC-MLC-40N TXK-40WSW IGB-VUZ-MGM-HRV-60S BTR-40N
IAH-60SW SJT-40ENE LBB-60WSW OKC
WST ISSUANCES EXPD. REFER TO MOST RECENT ACUS01 KWNS FROM STORM PREDICTION CENTER FOR SYNOPSIS AND METEOROLOGICAL DETAILS
| Product Type | Issuance Time | Issuance Frequency |
| AIRMETs over the Contiguous U.S. | 0245, 0845, 1445, 2045 UTC | Every 6 hours |
| AIRMETs over Alaska | 0515, 1315, 2115 UTC (standard time) 0415, 1215, 2015 UTC (Daylight savings time) | Every 8 hours |
| AIRMETs over Hawaii | 0400, 1000, 1600, 2200 UTC | Every 6 hours |
EXAMPLE- Example of AIRMET Sierra issued for the Southeast Alaska area: WA AK47 PAWU 241324 WA 7O JNUS WA 241315 AIRMET SIERRA FOR IFR AND MT OBSC VALID UNTIL 242115 LYNN CANAL AND GLACIER BAY JB MTS OBSC BY CLDS/ISOL PCPN. NC. CNTRL SE AK JC MTS OCNL OBSC IN CLDS. NC. SRN SE AK JD PAWG-PAKT LN W OCNL CIGS BLW 010/VIS BLW 3SM BR. IMPR. ERN GLF CST JE OCNL CIGS BLW 010/VIS BLW 3SM BR/-RA BR. DTRT. =JNUT WA 241315 AIRMET TANGO FOR TURB/STG SFC WINDS VALID UNTIL 242115 ERN GLF CST JE OFSHR ICY BAY W SUSTAINED SFC WND 30 KTS OR GTR. SPRDG E. INTSF. =JNUZ WA 241315 AIRMET ZULU FOR ICING VALID UNTIL 242115 ERN GLF CST JE 16Z TO 19Z ALG CST W ICY BAY OCNL MOD ICEIC 080-160. FZLVL 045 EXC 015 INLAND. WKN.
EXAMPLE- Example of AIRMET Tango issued for Hawaii FA area: WA HW31 PHFO 241529 WA 0HI HNLS WA 241600 AIRMET SIERRA UPDATE 2 FOR IFR VALID UNTIL 242200 NO SIGNIFICANT IFR EXP. =HNLT WA 241600 AIRMET TANGO UPDATE 3 FOR TURB VALID UNTIL 242200 AIRMET TURB. HI OVER AMD IMT S THRU W OF MTN. TEMPO MOD TURB BLW 070. COND CONT BEYOND 2200Z. =HNLZ WA 241600 AIRMET ZULU UPDATE 2 FOR ICE AND FZLVL VALID UNTIL 242200 NO SIGNIFICANT ICE EXP
EXAMPLE- Example of an Aviation Watch Notification Message:
WWUS30 KWNS 271559
SAW2
SPC AWW 271559
WW 568 TORNADO AR LA MS 271605Z - 280000Z
AXIS..65 STATUTE MILES EAST AND WEST OF LINE..
45ESE HEZ/NATCHEZ MS/ - 50N TUP/TUPELO MS/
..AVIATION COORDS.. 55NM E/W /18WNW MCB - 60E MEM/
HAIL SURFACE AND ALOFT..3 INCHES. WIND GUSTS..70 KNOTS. MAX TOPS TO 550. MEAN STORM MOTION VECTOR 26030.
LAT. LON 31369169 34998991 34998762 31368948
THIS IS AN APPROXIMATION TO THE WATCH AREA. FOR A COMPLETE DEPICTION OF THE WATCH SEE WOUS64 KWNS FOR WOU2.
EXAMPLE- Example of a Public Tornado Watch Notification Message:
WWUS20 KWNS 050550
SEL2
SPC WW 051750
URGENT - IMMEDIATE BROADCAST REQUESTED
TORNADO WATCH NUMBER 243
NWS STORM PREDICTION CENTER NORMAN OK
1250 AM CDT MON MAY 5 2011
THE NWS STORM PREDICTION CENTER HAS ISSUED A
*TORNADO WATCH FOR PORTIONS OF
WESTERN AND CENTRAL ARKANSAS
SOUTHERN MISSOURI
FAR EASTERN OKLAHOMA
*EFFECTIVE THIS MONDAY MORNING FROM 1250 AM UNTIL 600 AM CDT.
. THIS IS A PARTICULARLY DANGEROUS SITUATION.
*PRIMARY THREATS INCLUDE
NUMEROUS INTENSE TORNADOES LIKELY
NUMEROUS SIGNIFICANT DAMAGING WIND GUSTS TO 80 MPH LIKELY
NUMEROUS VERY LARGE HAIL TO 4 INCHES IN DIAMETER LIKELY
THE TORNADO WATCH AREA IS APPROXIMATELY ALONG AND 100 STATUTE MILES EAST AND WEST OF A LINE FROM 15 MILES WEST NORTHWEST OF FORT LEONARD WOOD MISSOURI TO 45 MILES SOUTHWEST OF HOT SPRINGS ARKANSAS. FOR A COMPLETE DEPICTION OF THE WATCH SEE THE ASSOCIATED WATCH OUTLINE UPDATE (WOUS64 KWNS WOU2).
REMEMBER. A TORNADO WATCH MEANS CONDITIONS ARE FAVORABLE FOR TORNADOES AND SEVERE THUNDERSTORMS IN AND CLOSE TO THE WATCH AREA. PERSONS IN THESE AREAS SHOULD BE ON THE LOOKOUT FOR THREATENING WEATHER CONDITIONS AND LISTEN FOR LATER STATEMENTS AND POSSIBLE WARNINGS.
OTHER WATCH INFORMATION. THIS TORNADO WATCH REPLACES TORNADO WATCH NUMBER 237. WATCH NUMBER 237 WILL NOT BE IN EFFECT AFTER
1250 AM CDT. CONTINUE. WW 239. WW 240. WW 241. WW 242.
DISCUSSION. SRN MO SQUALL LINE EXPECTED TO CONTINUE EWD. WHERE LONG/HOOKED HODOGRAPHS SUGGEST THREAT FOR EMBEDDED SUPERCELLS/POSSIBLE TORNADOES. FARTHER S. MORE WIDELY SCATTERED
SUPERCELLS WITH A THREAT FOR TORNADOES WILL PERSIST IN VERY STRONGLY DEEP SHEARED/LCL ENVIRONMENT IN AR.
AVIATION. TORNADOES AND A FEW SEVERE THUNDERSTORMS WITH HAIL SURFACE AND ALOFT TO 4 INCHES. EXTREME TURBULENCE AND SURFACE WIND GUSTS TO 70 KNOTS. A FEW CUMULONIMBI WITH MAXIMUM TOPS TO 500. MEAN STORM MOTION VECTOR 26045.
EXAMPLE- ZKC3 CWA 032140
ZKC CWA 301 VALID UNTIL 032340
ISOLD SVR TSTM over KCOU MOVG SWWD 10 KTS ETC.
Terminal control facilities have the option to limit hazardous weather information broadcast as follows: Tower cab and approach control positions may opt to broadcast hazardous weather information alerts only when any part of the area described is within 50 miles of the airspace under their jurisdiction.
REFERENCE-
FAA Order JO 7110.65, Para 2-6-6, Hazardous Inflight Weather Advisory.
NOTE- The NOTAM -D and NOTAM -FDC products broadcast via FIS-B are limited to those issued or effective within the past 30 days. Except for TFRs, NOTAMs older than 30 days are not provided. The pilot in command is responsible for reviewing all necessary information prior to flight.
| Product | Update Interval 1 | Transmission Interval (95%) 2 | Basic Product |
| AIRMET | As Available | 5 minutes | Yes |
| AWW/WW | As Available, then at 15 minute intervals for 1 hour | 5 minutes | No |
| Ceiling | As Available | 10 minutes | No |
| Convective SIGMET | As Available, then at 15 minute intervals for 1 hour | 5 minutes | Yes |
| D-ATIS | As Available | 1 minute | No |
| Echo Top | 5 minutes | 5 minutes | No |
| METAR/SPECI | 1 minute (where available), As Available otherwise | 5 minutes | Yes |
| MRMS NEXRAD (CONUS) | 2 minutes | 15 minutes | Yes |
| MRMS NEXRAD (Regional) | 2 minutes | 2.5 minutes | Yes |
| NOTAMs-D/FDC | As Available | 10 minutes | Yes |
| NOTAMs-TFR | As Available | 10 minutes | Yes |
| PIREP | As Available | 10 minutes | Yes |
| SIGMET | As Available, then at 15 minute intervals for 1 hour | 5 minutes | Yes |
| SUA Status | As Available | 10 minutes | Yes |
| TAF/AMEND | 6 Hours (±15 minutes) | 10 minutes | Yes |
| Temperature Aloft | 12 Hours (±15 minutes) | 10 minutes | Yes |
| TWIP | As Available | 1 minute | No |
| Winds aloft | 12 Hours (±15 minutes) | 10 minutes | Yes |
| Lightning strikes 3 | 5 minutes | 5 minutes | Yes |
| Turbulence 3 | 1 minute | 15 minutes | Yes |
| Icing, Forecast Potential (FIP) 3 | 60 minutes | 15 minutes | Yes |
| Cloud tops 3 | 30 minutes | 15 minutes | Yes |
| 1 Minute AWOS 3 | 1 minute | 10 minutes | No |
| Graphical-AIRMET 3 | As Available | 5 minutes | Yes |
| Center Weather Advisory (CWA) 3 | As Available | 10 minutes | Yes |
| Temporary Restricted Areas (TRA) | As Available | 10 minutes | Yes |
| Temporary Military Operations Areas (TMOA) | As Available | 10 minutes | Yes |
1 The Update Interval is the rate at which the product data is available from the source. 2 The Transmission Interval is the amount of time within which a new or updated product transmission must be completed (95%) and the rate or repetition interval at which the product is rebroadcast (95%). 3 The transmission and update intervals for the expanded set of basic meteorological products may be adjusted based on FAA and vendor agreement on the final product formats and performance requirements.
TBL 7-1-4
Product Parameters for Low/Medium/High Altitude Tier Radios
Product
Surface Radios
Low Altitude Tier
Medium Altitude Tier
High Altitude Tier
CONUS NEXRAD not provided
CONUS NEXRAD imagery
CONUS NEXRAD imagery
Winds & Temps Aloft
500 NM look-ahead range
500 NM look-ahead range
750 NM look-ahead range
1,000 NM look-ahead range
100 NM look-ahead range
250 NM look-ahead range
375 NM look-ahead range
CONUS: CONUS Class B & C airport METARs and 500 NM look-ahead range
Outside of CONUS: 500 NM look-ahead
range
100 NM look-ahead range
250 NM look-ahead range
375 NM look-ahead range
CONUS: CONUS Class B & C airport TAFs and 500 NM look-ahead range
Outside of CONUS: 500 NM look-ahead
range
AIRMET, SIGMET, PIREP, and SUA/SAA
100 NM look-ahead range. PIREP/SUA/SAA is N/A.
250 NM look-ahead range
375 NM look-ahead range
500 NM look-ahead range
150 NM look-ahead range
150 NM look-ahead range
200 NM look-ahead range
250 NM look-ahead range
NOTAMs D, FDC, and TFR
100 NM look-ahead range
100 NM look-ahead range
100 NM look-ahead range
100 NM look-ahead range
NOTE- When the barometric pressure exceeds 31.00 inches Hg., see AIM, Para 7-2-3, Altimeter Errors.EXAMPLE- “Bremerton National Airport automated weather observation, one four five six zulu;”
“Ravenswood Jackson County Airport automated weather observation, one four five six zulu.”
EXAMPLE- “Sault Ste. Marie, Chippewa County International Airport automated weather observation;”
“Sandusky, Cowley Field automated weather observation.”
EXAMPLE- “Bremerton National Airport automated weather observation, one four five six zulu. Ceiling two thousand overcast;” “Bremerton National Airport automated weather observation, one four five six zulu. Indefinite ceiling two hundred, sky obscured.”
EXAMPLE- “No clouds below one two thousand.”EXAMPLE- “Remarks . density altitude, two thousand five hundred . visibility variable between one and two . wind direction variable between two four zero and three one zero . observed weather . thunderstorm moderate rain showers and fog . thunderstorm overhead.”
EXAMPLE- “Ceiling one thousand overcast . visibility three . precipitation . temperature three zero, dew point missing . wind calm . altimeter three zero zero one.”
EXAMPLE- “Remarks . density altitude, two thousand five hundred . visibility variable between one and two . wind direction variable between two four zero and three one zero . observer ceiling estimated two thousand broken . observer temperature two, dew point minus five.”
NOTE- Wind direction is reported relative to magnetic north in ATIS as well as ASOS and AWOS radio (voice) broadcasts.
NOTE- To decode an ASOS/AWOS report, refer to FIG 7-1-8 and FIG 7-1-9.REFERENCE- A complete explanation of METAR terminology is located in AIM, Para 7-1-28, Key to Aerodrome Forecast (TAF) and Aviation Routine Weather Report (METAR).
FIG 7-1-8 
| Type | |||||||||||||
| ASOS | X | X | X | X | X | X | X | X | X | X | |||
| AWOS-A | X | ||||||||||||
| AWOS-A/V | X | X | |||||||||||
| AWOS-1 | X | X | X | X | |||||||||
| AWOS-2 | X | X | X | X | X | ||||||||
| AWOS-3 | X | X | X | X | X | X | |||||||
| AWOS-3P | X | X | X | X | X | X | X | ||||||
| AWOS-3T | X | X | X | X | X | X | X | ||||||
| AWOS-3P/T | X | X | X | X | X | X | X | X | |||||
| AWOS-4 | X | X | X | X | X | X | X | X | X | X | X | X | |
| Manual | X | X | X | X | X | X | X | ||||||
| REFERENCE- FAA Order JO 7900.5, Surface Weather Observing, for element reporting. | |||||||||||||
| SERVICE LEVEL A | ||||
| Service Level A consists of all the elements of Service Levels B, C and D plus the elements listed to the right, if observed. | 10 minute longline RVR at precedented sites or additional visibility increments of 1/8, 1/16 and 0 Sector visibility Variable sky condition Cloud layers above 12,000 feet and cloud types Widespread dust, sand and other obscurations Volcanic eruptions | |||
| SERVICE LEVEL B | ||||
| Service Level B consists of all the elements of Service Levels C and D plus the elements listed to the right, if observed. | Longline RVR at precedented sites (may be instantaneous readout) Freezing drizzle versus freezing rain Ice pellets Snow depth & snow increasing rapidly remarks Thunderstorm and lightning location remarks Observed significant weather not at the station remarks | |||
| SERVICE LEVEL C | ||||
| Service Level C consists of all the elements of Service Level D plus augmentation and backup by a human observer or an air traffic control specialist on location nearby. Backup consists of inserting the correct value if the system malfunctions or is unrepresentative. Augmentation consists of adding the elements listed to the right, if observed. During hours that the observing facility is closed, the site reverts to Service Level D. | Thunderstorms Tornadoes Hail Virga Volcanic ash Tower visibility Operationally significant remarks as deemed appropriate by the observer | |||
| SERVICE LEVEL D | ||||
| This level of service consists of an ASOS or AWOS continually measuring the atmosphere at a point near the runway. The ASOS or AWOS senses and measures the weather parameters listed to the right. | Wind Visibility Precipitation/Obstruction to vision Cloud height Sky cover Temperature Dew point Altimeter | |||
 FIG 7-1-11
 FIG 7-1-12
REFERENCE- P/CG Term - PRECIPITATION RADAR WEATHER DESCRIPTIONS.
AIM, Para 7-1-26, Thunderstorms.
Chart Supplement, Charts, NWS Upper Air Observing Stations and Weather Network for the location of specific radar sites.
NOTE- En route ATC radar's Weather and Radar Processor (WARP) does not display light precipitation intensity.
| Category | Visibility (RVR) |
| Nonprecision | 2,400 feet |
| Category I | 1,800 feet* |
| Category II | 1,000 feet |
| Category IIIa | 700 feet |
| Category IIIb | 150 feet |
| Category IIIc | 0 feet |
REFERENCE- AIM, Para 7-1-28, Key to Aerodrome Forecast (TAF) and Aviation Routine Weather Report (METAR), defines “broken,” “overcast,” and “obscuration.”
EXAMPLE-
| PIREP ELEMENT | PIREP CODE | CONTENTS | |
| 1. | 3-letter station identifier | XXX | Nearest weather reporting location to the reported phenomenon |
| 2. | Report type | UA or UUA | Routine or Urgent PIREP |
| 3. | Location | /OV | In relation to a VOR |
| 4. | Time | /TM | Coordinated Universal Time |
| 5. | Altitude | /FL | Essential for turbulence and icing reports |
| 6. | Type Aircraft | /TP | Essential for turbulence and icing reports |
| 7. | Sky cover | /SK | Cloud height and coverage (sky clear, few, scattered, broken, or overcast) |
| 8. | Weather | /WX | Flight visibility, precipitation, restrictions to visibility, etc. |
| 9. | Temperature | /TA | Degrees Celsius |
| 10. | Wind | /WV | Direction in degrees magnetic north and speed in knots |
| 11. | Turbulence | /TB | See AIM paragraph 7-1-21 |
| 12. | Icing | /IC | See AIM paragraph 7-1-19 |
| 13. | Remarks | /RM | For reporting elements not included or to clarify previously reported items |
NOTE- Severe icing is aircraft dependent, as are the other categories of icing intensity. Severe icing may occur at any ice accumulation rate when the icing rate or ice accumulations exceed the tolerance of the aircraft.
EXAMPLE- Pilot report: give aircraft identification, location, time (UTC), intensity of type, altitude/FL, aircraft type, indicated air speed (IAS), and outside air temperature (OAT).
| Clear Ice | See Glaze Ice. |
| Glaze Ice | Ice, sometimes clear and smooth, but usually containing some air pockets, which results in a lumpy translucent appearance. Glaze ice results from supercooled drops/droplets striking a surface but not freezing rapidly on contact. Glaze ice is denser, harder, and sometimes more transparent than rime ice. Factors, which favor glaze formation, are those that favor slow dissipation of the heat of fusion (i.e., slight supercooling and rapid accretion). With larger accretions, the ice shape typically includes “horns” protruding from unprotected leading edge surfaces. It is the ice shape, rather than the clarity or color of the ice, which is most likely to be accurately assessed from the cockpit. The terms “clear” and “glaze” have been used for essentially the same type of ice accretion, although some reserve “clear” for thinner accretions which lack horns and conform to the airfoil. |
| Intercycle Ice | Ice which accumulates on a protected surface between actuation cycles of a deicing system. |
| Known or Observed or Detected Ice Accretion | Actual ice observed visually to be on the aircraft by the flight crew or identified by on-board sensors. |
| Mixed Ice | Simultaneous appearance or a combination of rime and glaze ice characteristics. Since the clarity, color, and shape of the ice will be a mixture of rime and glaze characteristics, accurate identification of mixed ice from the cockpit may be difficult. |
| Residual Ice | Ice which remains on a protected surface immediately after the actuation of a deicing system. |
| Rime Ice | A rough, milky, opaque ice formed by the rapid freezing of supercooled drops/droplets after they strike the aircraft. The rapid freezing results in air being trapped, giving the ice its opaque appearance and making it porous and brittle. Rime ice typically accretes along the stagnation line of an airfoil and is more regular in shape and conformal to the airfoil than glaze ice. It is the ice shape, rather than the clarity or color of the ice, which is most likely to be accurately assessed from the cockpit. |
| Runback Ice | Ice which forms from the freezing or refreezing of water leaving protected surfaces and running back to unprotected surfaces. |
| Note- Ice types are difficult for the pilot to discern and have uncertain effects on an airplane in flight. Ice type definitions will be included in the AIM for use in the “Remarks” section of the PIREP and for use in forecasting. | |
| Intensity | Aircraft Reaction | Reaction Inside Aircraft | Reporting Term-Definition |
| Light | Turbulence that momentarily causes slight, erratic changes in altitude and/or attitude (pitch, roll, yaw). Report as Light Turbulence; 1 or Turbulence that causes slight, rapid and somewhat rhythmic bumpiness without appreciable changes in altitude or attitude. Report as Light Chop. | Occupants may feel a slight strain against seat belts or shoulder straps. Unsecured objects may be displaced slightly. Food service may be conducted and little or no difficulty is encountered in walking. | Occasional-Less than 1 /3 of the time. Intermittent- 1 /3 to 2 /3. Continuous-More than 2 /3. |
| Moderate | Turbulence that is similar to Light Turbulence but of greater intensity. Changes in altitude and/or attitude occur but the aircraft remains in positive control at all times. It usually causes variations in indicated airspeed. Report as Moderate Turbulence; 1 or Turbulence that is similar to Light Chop but of greater intensity. It causes rapid bumps or jolts without appreciable changes in aircraft altitude or attitude. Report as Moderate Chop. 1 | Occupants feel definite strains against seat belts or shoulder straps. Unsecured objects are dislodged. Food service and walking are difficult. | NOTE 1. Pilots should report location(s), time (UTC), intensity, whether in or near clouds, altitude, type of aircraft and, when applicable, duration of turbulence. 2. Duration may be based on time between two locations or over a single location. All locations should be readily identifiable. |
| Severe | Turbulence that causes large, abrupt changes in altitude and/or attitude. It usually causes large variations in indicated airspeed. Aircraft may be momentarily out of control. Report as Severe Turbulence. 1 | Occupants are forced violently against seat belts or shoulder straps. Unsecured objects are tossed about. Food Service and walking are impossible. | EXAMPLES: a. Over Omaha. 1232Z, Moderate Turbulence, in cloud, Flight Level 310, B707. |
| Extreme | Turbulence in which the aircraft is violently tossed about and is practically impossible to control. It may cause structural damage. Report as Extreme Turbulence. 1 | b. From 50 miles south of Albuquerque to 30 miles north of Phoenix, 1210Z to 1250Z, occasional Moderate Chop, Flight Level 330, DC8. | |
| 1 High level turbulence (normally above 15,000 feet ASL) not associated with cumuliform cloudiness, including thunderstorms, should be reported as CAT (clear air turbulence) preceded by the appropriate intensity, or light or moderate chop. | |||
EXAMPLE- Miami Tower, Gulfstream 403 Charlie encountered an abrupt wind shear at 800 feet on final, max thrust required.
EXAMPLE- “Denver Tower, United 1154, wind shear escape."EXAMPLE- “Denver Tower, United ll54, wind shear escape complete, resuming last assigned heading/(name) DP /clearance."
or
“Denver Tower, United ll54, wind shear escape complete, request further instructions."
| 27A MBA 35K- 2MF 250 20 |
In plain language, the controller is telling the pilot that on approach to runway 27, there is a microburst alert on the approach lane to the runway, and to anticipate or expect a 35 knot loss of airspeed at approximately 2 miles out on final approach (where it will first encounter the phenomena). With that information, the aircrew is forewarned, and should be prepared to apply wind shear/microburst escape procedures should they decide to continue the approach. Additionally, the surface winds at the airport for landing runway 27 are reported as 250 degrees at 20 knots.
NOTE- Threshold wind is at pilot's request or as deemed appropriate by the controller.REFERENCE- FAA Order JO 7110.65, Para 3-1-8b2(a), Air Traffic Control, Low Level Wind Shear/Microburst Advisories.
FIG 7-1-18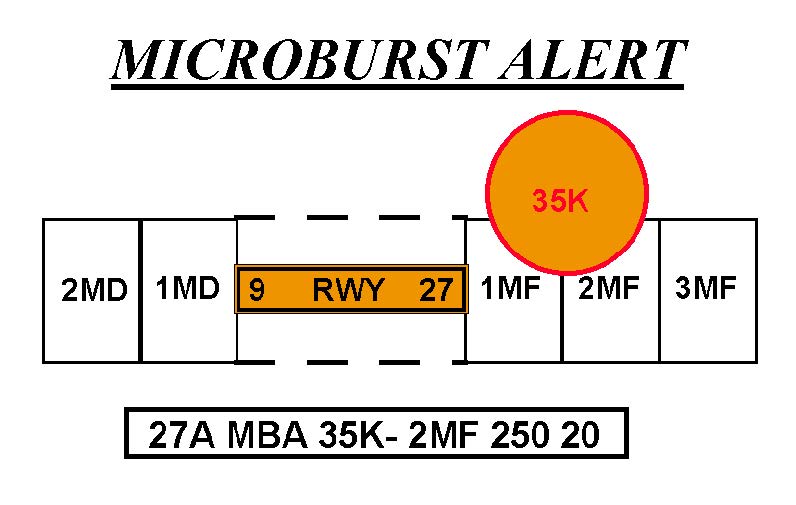
WIND SHEAR ALERTS
EXAMPLE- This is what the controller sees on his/her ribbon display in the tower cab.| 27A WSA 20K- 3MF 200 15 |
In plain language, the controller is advising the aircraft arriving on runway 27 that at about 3 miles out they can expect to encounter a wind shear condition that will decrease their airspeed by 20 knots and possibly encounter turbulence. Additionally, the airport surface winds for landing runway 27 are reported as 200 degrees at 15 knots.
NOTE- Threshold wind is at pilot's request or as deemed appropriate by the controller.REFERENCE- FAA Order JO 7110.65, Para 3-1-8, Low Level Wind Shear/Microburst Advisories, Subpara b2(a).
FIG 7-1-19 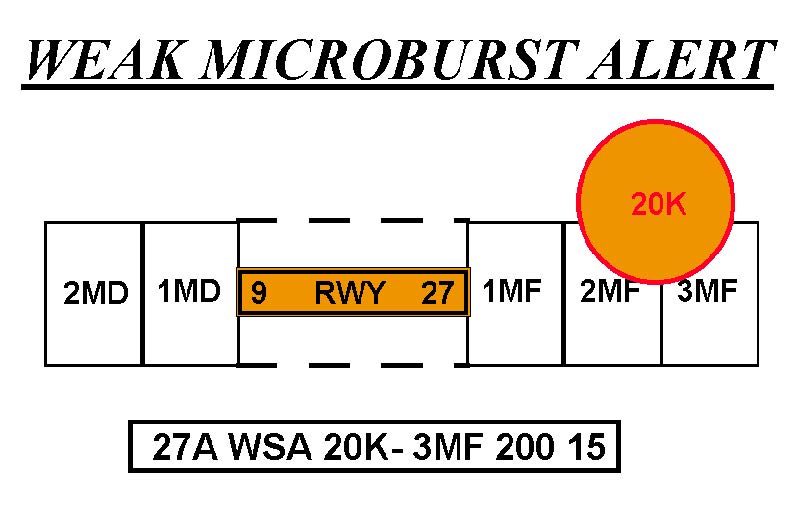
MULTIPLE WIND SHEAR ALERTS
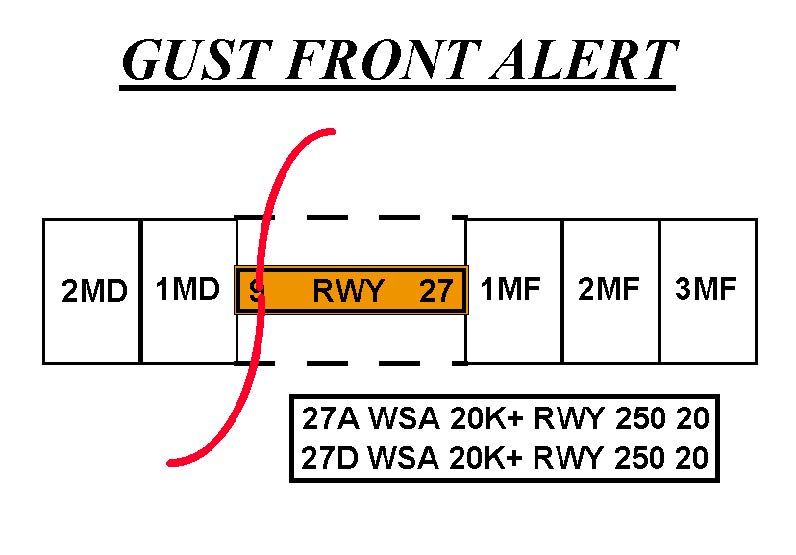
EXAMPLE- This is what the controller sees on his/her ribbon display in the tower cab.| 27A WSA 20K+ RWY 250 20 |
| 27D WSA 20K+ RWY 250 20 |
PHRASEOLOGY- MULTIPLE WIND SHEAR ALERTS. RUNWAY 27 ARRIVAL, WIND SHEAR ALERT, 20 KT GAIN ON RUNWAY; RUNWAY 27 DEPARTURE, WIND SHEAR ALERT, 20 KT GAIN ON RUNWAY, WIND 250 AT 20.
EXAMPLE- In this example, the controller is advising arriving and departing aircraft that they could encounter a wind shear condition right on the runway due to a gust front (significant change of wind direction) with the possibility of a 20 knot gain in airspeed associated with the gust front. Additionally, the airport surface winds (for the runway in use) are reported as 250 degrees at 20 knots.
REFERENCE- FAA Order 7110.65, Para 3-1-8, Low Level Wind Shear/Microburst Advisories, Subpara b2(d). FIG 7-1-21
| Airport | Identifier |
| Andrews AFB, MD | KADW |
| Hartsfield-Jackson Atlanta Intl Airport | KATL |
| Nashville Intl Airport | KBNA |
| Logan Intl Airport | KBOS |
| Baltimore/Washington Intl Airport | KBWI |
| Hopkins Intl Airport | KCLE |
| Charlotte/Douglas Intl Airport | KCLT |
| Port Columbus Intl Airport | KCMH |
| Cincinnati/Northern Kentucky Intl Airport | KCVG |
| Dallas Love Field Airport | KDAL |
| James M. Cox Intl Airport | KDAY |
| Ronald Reagan Washington National Airport | KDCA |
| Denver Intl Airport | KDEN |
| Dallas-Fort Worth Intl Airport | KDFW |
| Detroit Metro Wayne County Airport | KDTW |
| Newark Liberty Intl Airport | KEWR |
| Fort Lauderdale-Hollywood Intl Airport | KFLL |
| William P. Hobby Airport | KHOU |
| Washington Dulles Intl Airport | KIAD |
| George Bush Intercontinental Airport | KIAH |
| Wichita Mid-Continent Airport | KICT |
| Indianapolis Intl Airport | KIND |
| John F. Kennedy Intl Airport | KJFK |
| Harry Reid Intl Airport | KLAS |
| LaGuardia Airport | KLGA |
| Kansas City Intl Airport | KMCI |
| Orlando Intl Airport | KMCO |
| Midway Intl Airport | KMDW |
| Memphis Intl Airport | KMEM |
| Miami Intl Airport | KMIA |
| General Mitchell Intl Airport | KMKE |
| Minneapolis St. Paul Intl Airport | KMSP |
| Louis Armstrong New Orleans Intl Airport | KMSY |
| Will Rogers World Airport | KOKC |
| O'Hare Intl Airport | KORD |
| Palm Beach Intl Airport | KPBI |
| Philadelphia Intl Airport | KPHL |
| Phoenix Sky Harbor Intl Airport | KPHX |
| Pittsburgh Intl Airport | KPIT |
| Raleigh-Durham Intl Airport | KRDU |
| Louisville Intl Airport | KSDF |
| Salt Lake City Intl Airport | KSLC |
| Lambert-St. Louis Intl Airport | KSTL |
| Tampa Intl Airport | KTPA |
| Tulsa Intl Airport | KTUL |
| Luis Munoz Marin Intl Airport | TJSJ |
 FIG 7-1-23
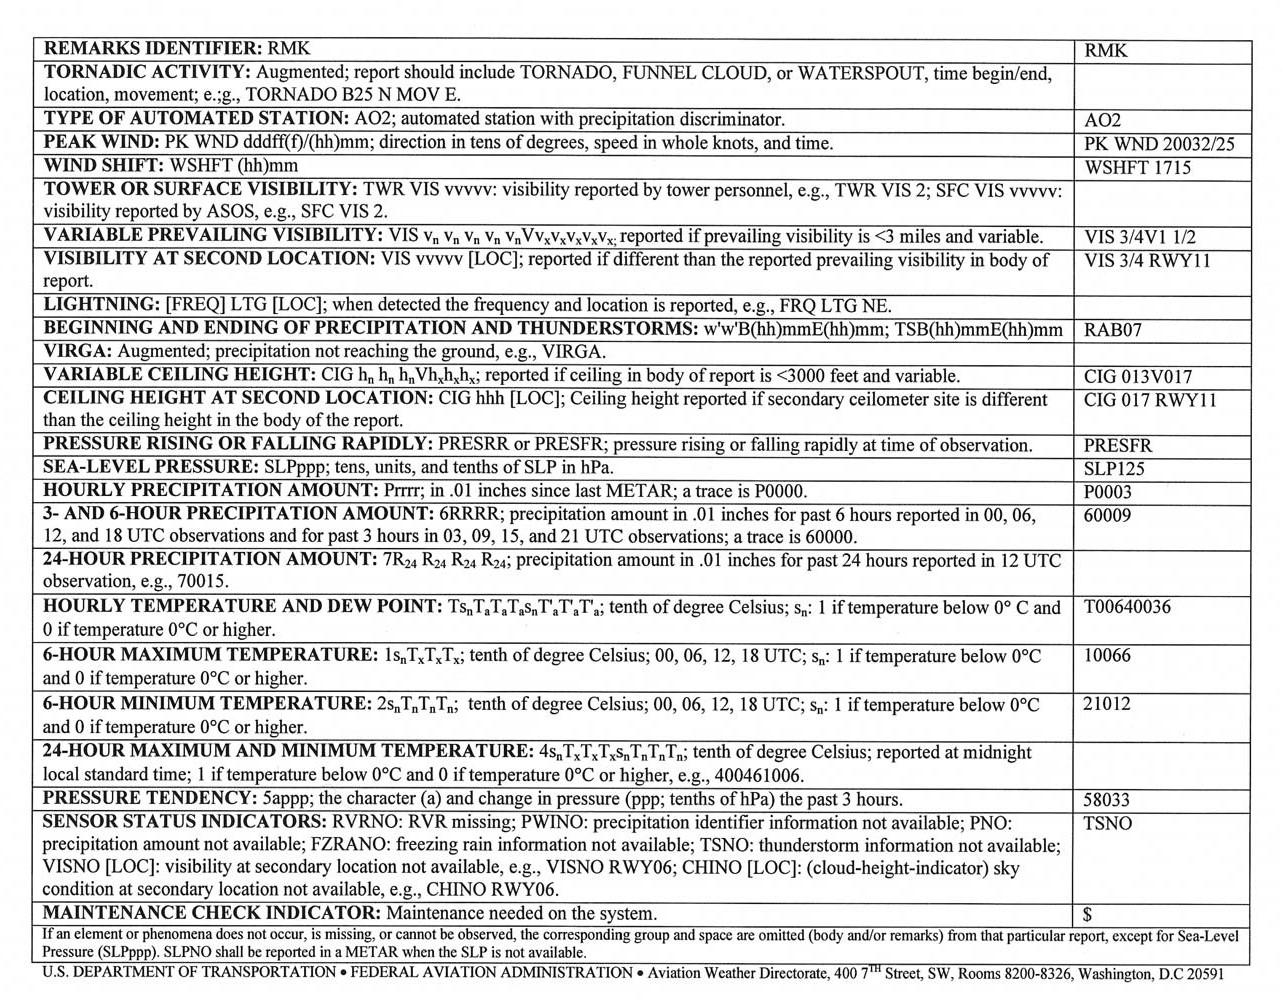
NOTE- There are two types of automated stations, AO1 for automated weather reporting stations without a precipitation discriminator, and AO2 for automated stations with a precipitation discriminator. (A precipitation discriminator can determine the difference between liquid and frozen/freezing precipitation). This information appears in the remarks section of an automated report.
EXAMPLE- 13008KT - wind from 130 degrees at 8 knots
08032G45KT - wind from 080 degrees at 32 knots with gusts to 45 knots
VRB04KT - wind variable in direction at 4 knots
00000KT - wind calm
210103G130KT - wind from 210 degrees at 103 knots with gusts to 130 knots
If the wind direction is variable by 60 degrees or more and the speed is greater than 6 knots, a variable group consisting of the extremes of the wind direction separated by a “v” will follow the prevailing wind group.
32012G22KT 280V350
NOTE- Automated sites that are augmented by human observer to meet service level requirements can report 0, 1/16 SM, and 1/8 SM visibility increments.
EXAMPLE- VIS N2 - visibility north twoEXAMPLE- R32L/1200FT - runway three two left R-V-R one thousand two hundred.
R27R/M1000V4000FT - runway two seven right R-V-R variable from less than one thousand to four thousand.
NOTE- The “/” above and in the following descriptions (except as the separator between the temperature and dew point) are for separation purposes in this publication and do not appear in the actual METARs.
| TS | thunderstorm |
| DR | low drifting |
| SH | showers |
| MI | shallow |
| FZ | freezing |
| BC | patches |
| BL | blowing |
| PR | partial |
NOTE- Although “TS” and “SH” are used with precipitation and may be preceded with an intensity symbol, the intensity still applies to the precipitation, not the descriptor.
| RA | rain |
| DZ | drizzle |
| SN | snow |
| GR | hail ( 1 /4” or greater) |
| GS | small hail/snow pellets |
| PL | ice pellets |
| SG | snow grains |
| IC | ice crystals (diamond dust) |
| UP | unknown precipitation (automated stations only) |
| FG | fog (vsby less than 5 /8 mile) |
| HZ | haze |
| FU | smoke |
| PY | spray |
| BR | mist (vsby 5 /8 - 6 miles) |
| SA | sand |
| DU | dust |
| VA | volcanic ash |
NOTE- Fog (FG) is observed or forecast only when the visibility is less than five-eighths of mile, otherwise mist (BR) is observed or forecast.
| SQ | squall |
| SS | sandstorm |
| DS | duststorm |
| PO | dust/sand whirls |
| FC | funnel cloud |
| +FC | tornado/waterspout |
| TSRA | thunderstorm with moderate rain |
| + SN | heavy snow |
| -RA FG | light rain and fog |
| BRHZ | mist and haze (visibility 5 /8 mile or greater) |
| FZDZ | freezing drizzle |
| VCSH | rain shower in the vicinity |
| +SHRASNPL | heavy rain showers, snow, ice pellets (intensity indicator refers to the predominant rain) |
| SKC | clear (no clouds) |
| FEW | >0 to 2 /8 |
| SCT | scattered ( 3 /8s to 4 /8s of clouds) |
| BKN | broken ( 5 /8s to 7 /8s of clouds) |
| OVC | overcast ( 8 /8s clouds) |
| CB | Cumulonimbus when present |
| TCU | Towering cumulus when present |
EXAMPLE- (Reported as) SCT025TCU BKN080 BKN250 (spoken as) “TWO THOUSAND FIVE HUNDRED SCATTERED TOWERING CUMULUS, CEILING EIGHT THOUSAND BROKEN, TWO FIVE THOUSAND BROKEN.”
(Reported as) SCT008 OVC012CB (spoken as) “EIGHT HUNDRED SCATTERED CEILING ONE THOUSAND TWO HUNDRED OVERCAST CUMULONIMBUS CLOUDS.”
EXAMPLE- BKN000 (in body) - “sky partially obscured”
FU BKN000 (in remarks) - “smoke obscuring five- to seven-eighths of the sky”
EXAMPLE- BKN020 (in body) - “ceiling two thousand broken”
RMK FU BKN020 - “broken layer of smoke aloft, based at two thousand”
EXAMPLE- SCT V BKN - “scattered layer variable to broken”
BKN025 V OVC - “broken layer at two thousand five hundred variable to overcast”
EXAMPLE- CB W MOV E - “cumulonimbus west moving east”
CBMAM DSNT S - “cumulonimbus mammatus distant south”
EXAMPLE- ACC W - “altocumulus castellanus west”
ACSL SW-S - “standing lenticular altocumulus southwest through south”
APRNT ROTOR CLD S - “apparent rotor cloud south”
CCSL OVR MT E - “standing lenticular cirrocumulus over the mountains east”
EXAMPLE- 15/08 - “temperature one five, dew point 8”
00/M02 - “temperature zero, dew point minus 2”
M05/ - “temperature minus five, dew point missing”
Examples of METAR reports and explanation: METAR KBNA 281250Z 33018KT 290V360 1/2SM R31/2700FT SN BLSN FG VV008 00/M03 A2991 RMK RAE42 SN B42
| METAR | aviation routine weather report |
| KBNA | Nashville, TN |
| 281250Z | date 28 th , time 1250 UTC |
| (no modifier) | This is a manually generated report, due to the absence of “AUTO” and “AO1 or AO2” in remarks |
| 33018KT | wind three three zero at one eight |
| 290V360 | wind variable between two nine zero and three six zero |
| 1/2SM | visibility one half |
| R31/2700FT | Runway three one RVR two thousand seven hundred |
| SN | moderate snow |
| BLSN FG | visibility obscured by blowing snow and fog |
| VV008 | indefinite ceiling eight hundred |
| 00/M03 | temperature zero, dew point minus three |
| A2991 | altimeter two niner niner one |
| RMK | remarks |
| RAE42 | rain ended at four two |
| SNB42 | snow began at four two |
| METAR | aviation routine weather report |
| KSFO | San Francisco, CA |
| 041453Z | date 4 th , time 1453 UTC |
| AUTO | fully automated; no human intervention |
| VRB02KT | wind variable at two |
| 3SM | visibility three |
| BR | visibility obscured by mist |
| CLR | no clouds below one two thousand |
| 15/12 | temperature one five, dew point one two |
| A3012 | altimeter three zero one two |
| RMK | remarks |
| AO2 | this automated station has a weather discriminator (for precipitation) |
NOTE- The “/” above and in the following descriptions are for separation purposes in this publication and do not appear in the actual TAFs.
EXAMPLE- 18010KT - wind one eight zero at one zero (wind is blowing from 180).
35012G20KT - wind three five zero at one two gust two zero.
NOTE- It is very important that pilots understand that NSW only refers to weather phenomena, i.e., rain, snow, drizzle, etc. Omitted conditions, such as sky conditions, visibility, winds, etc., are carried over from the previous time group.
NOTE- As in METAR, ceiling layers are not designated in the TAF code. For aviation purposes, the ceiling is the lowest broken or overcast layer or vertical visibility into a complete obscuration.
| SKC | “sky clear” |
| SCT005 BKN025CB | “five hundred scattered, ceiling two thousand five hundred broken cumulonimbus clouds” |
| VV008 | “indefinite ceiling eight hundred” |
NOTE- NWS does not use PROB 40 in the TAF. However U.S. Military generated TAFS may include PROB40. PROB30 will not be shown during the first nine hours of a NWS forecast.
EXAMPLE-| PROB40 2221/2302 1 /2SM +TSRA | “chance between 2100Z and 0200Z of visibility one-half statute mile in thunderstorms and heavy rain.” |
| PROB30 3010/3014 1SM RASN | “chance between 1000Z and 1400Z of visibility one statute mile in mixed rain and snow.” |
EXAMPLE- FM210100 14010KT P6SM SKC - “after 0100Z on the 21st, wind one four zero at one zero, visibility more than six, sky clear.”
NOTE- The NWS does not use BECMG in the TAF.EXAMPLE- OVC012 BECMG 0114/0116 BKN020 - “ceiling one thousand two hundred overcast. Then a gradual change to ceiling two thousand broken between 1400Z on the 1st and 1600Z on the 1st.”